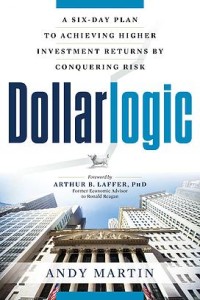
 Author Andy Martin began his investment career with Merrill Lynch and is cofounder and president of 7Twelve Advisors, LLC, an SEC Registered Investment Advisor, and registered representative, general securities principal with FINRA member firm, Girard Securities, Inc. Martin has worked in virtually every part of the securities industry, including operations, sales, management, product development, research, and compliance.
His research has been published or reviewed in a wide variety of journals and publications. He is Series 7, 24, 53, and 65 licensed, is a graduate of Belmont University (BBA Economics), and Vanderbilt University (MLAS).
In DollarLogic: A Six-Day Plan to Achieving Higher Investment Returns, Martin explains what risk really is, why stocks are actually less risky than bonds, and why predicting yourself is more important than predicting the stock market. The book outlines …
- The four types of investors and how to become the right one
- How losing less is better than winning more
- How to stop chasing returns and start chasing—and winning—odds
- Why a higher return investment can actually make you less money
- Why your no-load fund could be much more expensive than you think
The book opens with a Foreword by Arthur B. Laffer, PhD, a former economic advisor to Ronald Reagan. Right away Mr. Laffer informs the reader that Martin is prepared to challenge a well-known investment maxim by noting, “Risk equals reward. Well, maybe not.”
Over the course of the next 200 pages or so, Martin goes about making the case that risk does not necessarily equal reward. The layout of the book works well and is easy to follow. The three core areas: Think, Plan and Execute are each comprised of two chapters. Regular readers of this blog know that I am a huge believe in the idea that success, financial or otherwise, requires a detailed plan and focused execution. It isn’t a coincidence that the tagline of this blog is living better through planning.
To his credit, Martin makes good use of plenty of charts, graphs and tables to convey useful information or drive home a particular point. As an example, when discussing diversification, Martin shares a chart – he notes that it changed his life – that appeared in a 2008 article from the Wall Street Journal. Not only does the chart indicate aggregate annual rate of return for various degrees of diversification over a 37-year time period, it illustrates a reduction in the standard deviation (volatility) and a smaller percentage decline in the worst year as the portfolio becomes more diversified. Good stuff!
DollarLogic: A Six-Day Plan to Achieving Higher Investment Returns is available at Amazon in Kindle and Paperback formats.
The Giveaway – simply leave a comment to be entered – will end, and the winner selected, at 12:00 p.m. (EDT) on Sunday, December 5th.